Plan Explorer
I recently started using this. Since it was licensed earlier, now it’s free. This is an awesome tool for query performance tuning.
SQL Server Sentry Plan Explorer is the free tool given to SQL community you can download here https://www.sentryone.com/plan-explorer click download plan explorer button with right bit. It will not ask you much for download.
Plan Explorer really makes DBAs job easier, this will help to read the bigger execution plans quickly and which code block taken more time duration, even if it’s 1000 lines code.
Once you have installed, open the tool click file –> new and on command text ” select * from sysobjects o join sysindexes i on o.id=i.id ” and click get actual plan –> ok see how it shows on the results tab.
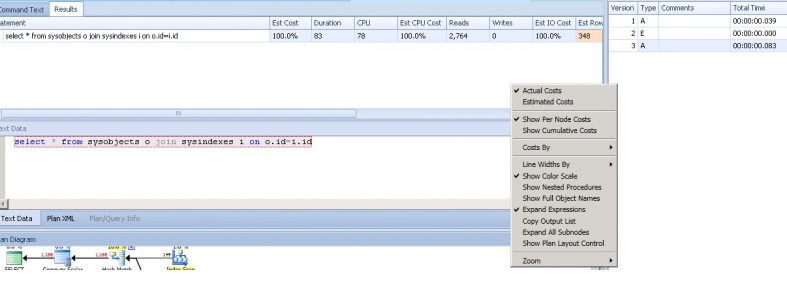
There are 1. Statement 2. Text 3. Bottom nine tab.
Click on the “plan diagram” tab and right click into it and see the various options.
Options to use 1. show cumulative cost 2. cost by CPU or IO or CPU+IO 3. Lines width by rows or data size 4. Full object name 5. Copy output list from any operator ex: Index scan.
There are other tabs are available, each will give more information. When you play with bigger text or longer running queries. You can use “Table operation” tab and sort it the cost and click the ” plan diagram” again this will tell you which operator used more cost. You can check the “Expression” and “Index Analysis” tab to get more details.
On “Statement” tab 1. There will be number of statement, click which one using more cost and check the 1. estimated and actual number of rows 2. Check the degree of parallelism etc.
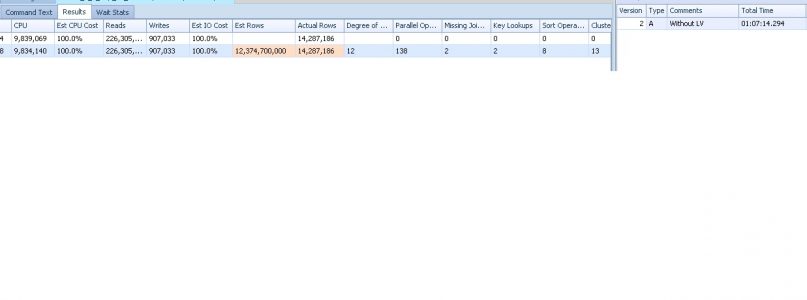
The estimated and actual number differ mostly by out of stats or skew data. One of my case, I used collect data by Whoisactive, this will have a query plan column also, I could see each time the plan differs, when it took high maxDOP it runs quick, I used DOP hint on the code to fix that.
Install it one of DBA centralized server and you can run query and capture the execution plans.
Key Points:
- It will show both estimated and actual plans
- you can upload a execution plan by invoking whoisactive table results. Or you can view the saved plans.
- This will not show you the result, it does not mean it will not run the code, it will run the code behind the screen, be careful on DML part, if you have any DML, you have to remove or change it to select statement.
- This will show the statistics details like a DBCC show statistics and you can run the update stats as well.
- It has a run history as well, you can rewrite and re-run your code and benchmark it.
You can get complete details here by Aaron Bertrand’s post: https://sqlperformance.com/2014/03/t-sql-queries/updated-plan-explorer-demo-kit